House prices increased by 2.9% in Preston in August, new Land Registry figures show
and live on Freeview channel 276
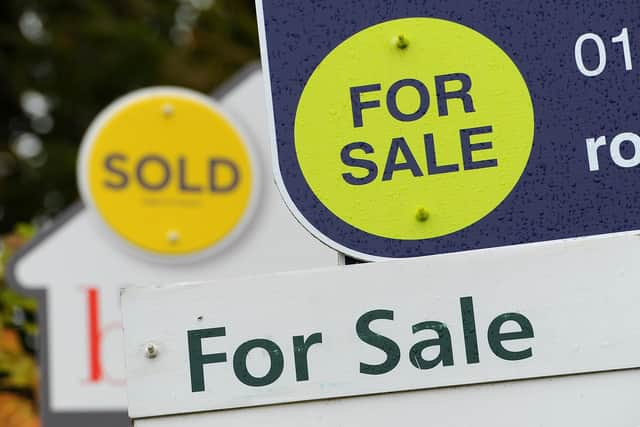
House prices increased by 2.9% in Preston in August, new figures show.
The rise contributes to the longer-term trend, which has seen property prices in the area grow by 4.7% over the last year.
Advertisement
Hide AdAdvertisement
Hide AdThe average Preston house price in August was £166,953, Land Registry figures show – a 2.9% increase on July.
Over the month, the picture was different to that across the North West, where prices remained static, and Preston was above the 0.3% rise for the UK as a whole.
Over the last year, the average sale price of property in Preston rose by £7,500 – putting the area seventh among the North West’s 35 local authorities with price data for annual growth.
The highest annual growth in the region was in Ribble Valley, where property prices increased on average by 6.8%, to £284,000. At the other end of the scale, properties in Burnley lost 5.6% of their value, giving an average price of £111,000.
Advertisement
Hide AdAdvertisement
Hide AdIn South Ribble, house prices increased slightly by 0.4%. In Chorley, prices increased by 0.8%.
The average house price in Chorley was £235,112. In South Ribble, the average price was £215,564.
First steps on the property ladder
First-time buyers in Preston spent an average of £136,600 on their property – £5,400 more than a year ago, and £30,400 more than in August 2018.
By comparison, former owner-occupiers paid £194,200 on average in August – 42.1% more than first-time buyers.
Property types
Advertisement
Hide AdAdvertisement
Hide AdOwners of detached houses saw the biggest rise in property prices in Preston in August – they increased 3.1%, to £316,442 on average. Over the last year, prices rose by 7.8%.
Among other types of property:
Semi-detached: up 3% monthly; up 4.6% annually; £187,724 average
Terraced: up 2.8% monthly; up 2.7% annually; £129,501 average
Flats: up 2.3% monthly; up 4.6% annually; £90,559 average
How do property prices in Preston compare?
Buyers paid 22.6% less than the average price in the North West (£216,000) in August for a property in Preston. Across the North West, property prices are low compared to those across the UK, where the average cost is £291,000.
Advertisement
Hide AdAdvertisement
Hide AdThe most expensive properties in the North West were in Trafford – £372,000 on average, and 2.2 times the price as in Preston. Trafford properties cost 3.4 times the price as homes in Burnley (£111,000 average), at the other end of the scale.
The highest property prices across the UK were in Kensington and Chelsea (£1.4 million).
Average property price in August
Preston: £166,953
The North West: £215,791
UK: £291,044
Annual growth to August
Preston: +4.7%
The North West: +0.4%
UK: +0.2%
Highest and lowest annual growth in the North West
Ribble Valley: +6.8%
Burnley: -5.6%